Your vineyard has a margin problem. You just can't see it yet.
vinwAIve is the AI intelligence layer for premium wine estates. It connects your yield, operations, and financial data across every block, every vintage, and every wine product, and surfaces what is costing you margin while there is still time to act on it.
Let's Talk See What It DoesEvery vintage you make decisions with half the picture.
Spreadsheets, paper maps, scouting notes on someone's phone, end-of-year reports from your accountant. The data exists. It's just scattered across six different places, arriving too late to act on, and never telling you what's actually happening at the block level.
Your data exists. It just doesn't talk to itself.
Yield in a spreadsheet. Financials with your accountant. Disease pressure in a notebook. Every decision gets made from a partial picture built by hand. vinwAIve connects all of it.
By the time you know, it's already too late.
Your vintage report lands six weeks after harvest. The decisions for next season are already in motion. vinwAIve gives you the same picture in-season, while there's still time to act.
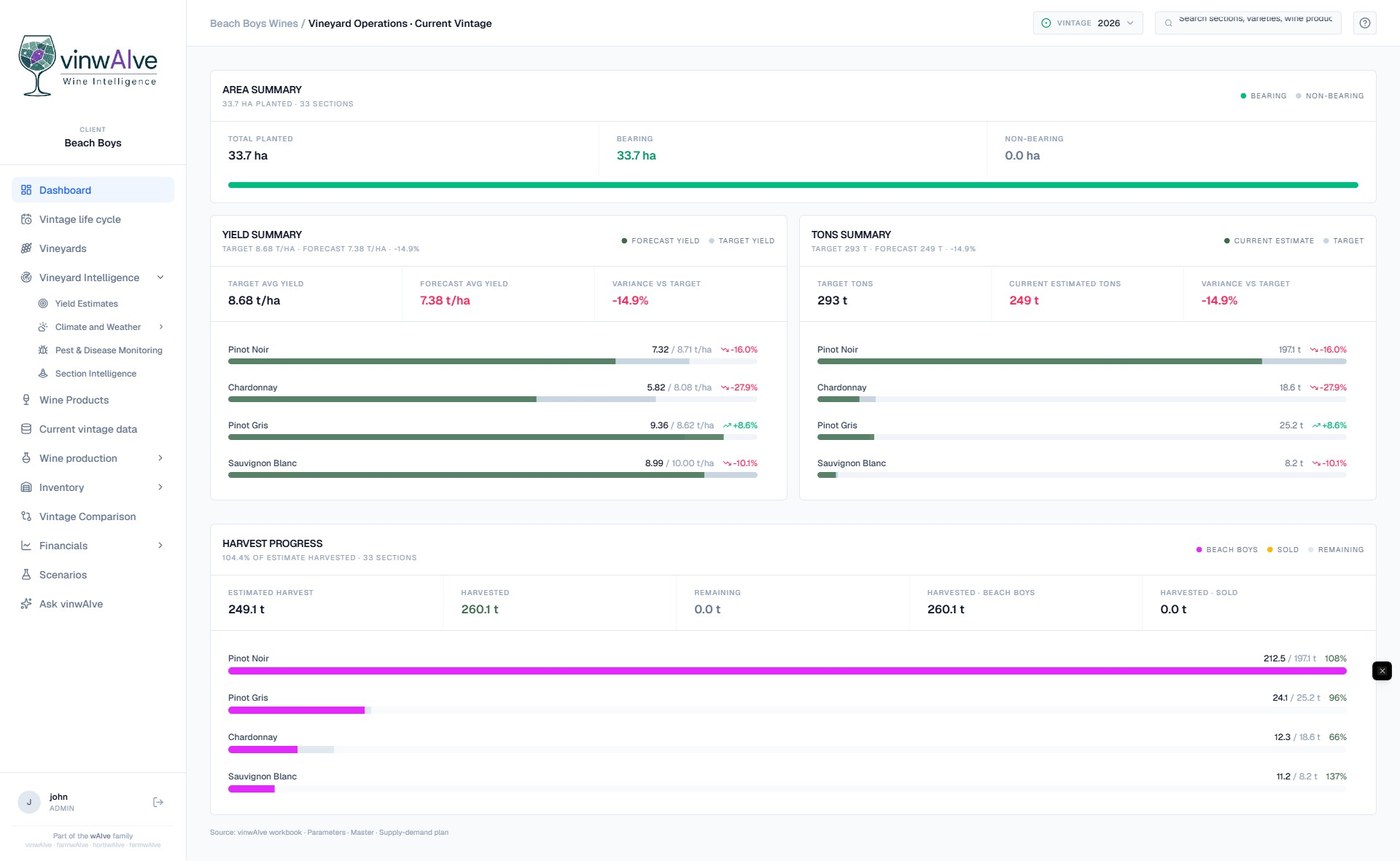
Your estate average is hiding your worst block.
A reasonable headline number can mask a 50-point GP spread between your best and worst sections. Estate averages don't reveal problems. They bury them.
Not a dashboard. An intelligence layer that thinks for your estate.
Most vineyard software is a rear-view mirror. vinwAIve is built so every section, every scouting note, every variety and every dollar feeds an intelligence platform designed to surface what matters while there's still time to act on it.
Predictive intelligence
Ask what this vintage will deliver in revenue, yield and margin before it does. vinwAIve models forward outcomes at the section level, not estate averages.
Preventative insight
Traffic-light rankings show which sections are drifting off yield or cost targets while there's still time to act. Flagged in-season, not six weeks after vintage.
Conversational AI
Ask anything. Which blocks should I prioritise? What's driving my Chardonnay margin gap? Where do I have a SKU deficit? Get answers, not just data.
One platform. Every number your estate generates. All season long.
Built for estates running multiple vineyards, varieties, and wine products across tools and teams that were never designed to connect. From vineyard operations to wine product margins, vinwAIve replaces the patchwork with one intelligence layer.
See problems during vintage, not after it
Section Intelligence ranks every block with a traffic light against its yield and cost targets: on track, 10% off, 15% or more off. When a section starts drifting, you see it with weeks to act, mapped and ranked by impact.
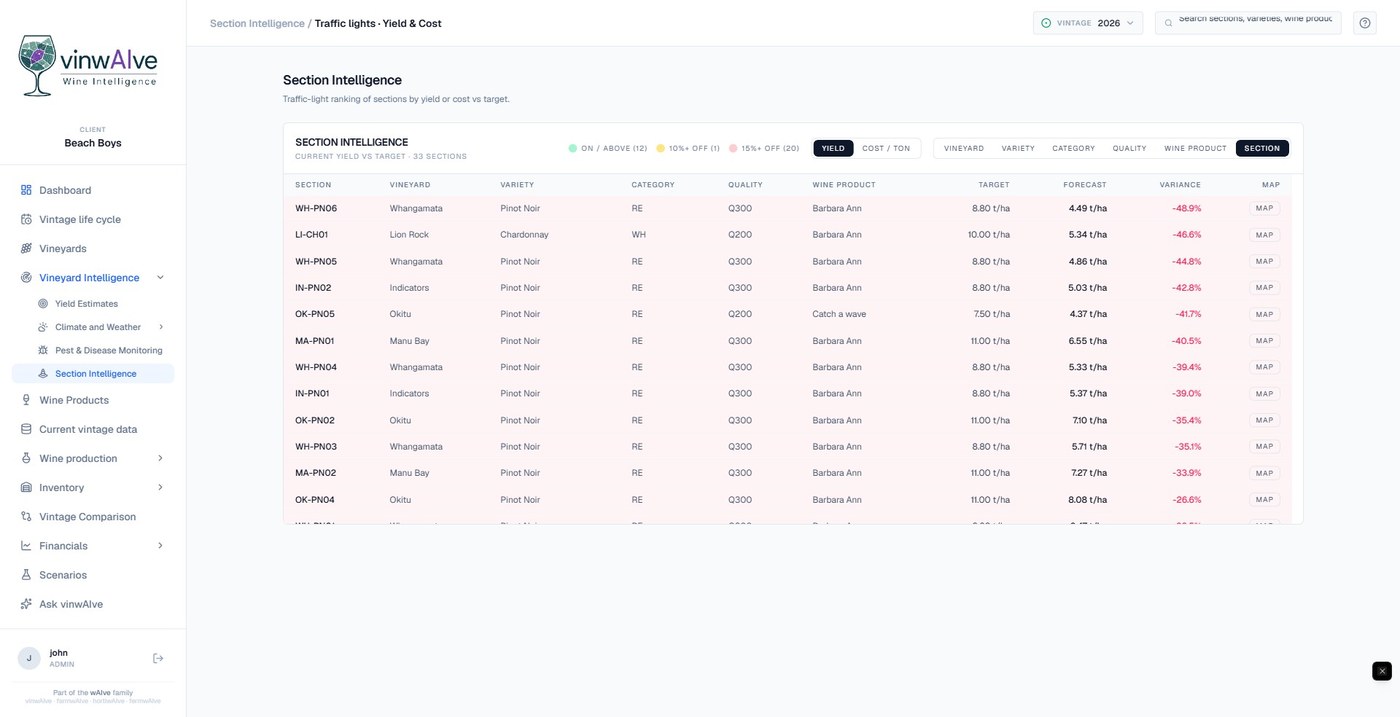
Your section P&L in-season. Not six weeks after vintage.
Revenue per hectare, gross profit margin, and cost per tonne at the block level, target versus actual, updated throughout the season. Not a blended estate number. The actual performance of every section, while it still affects your decisions.
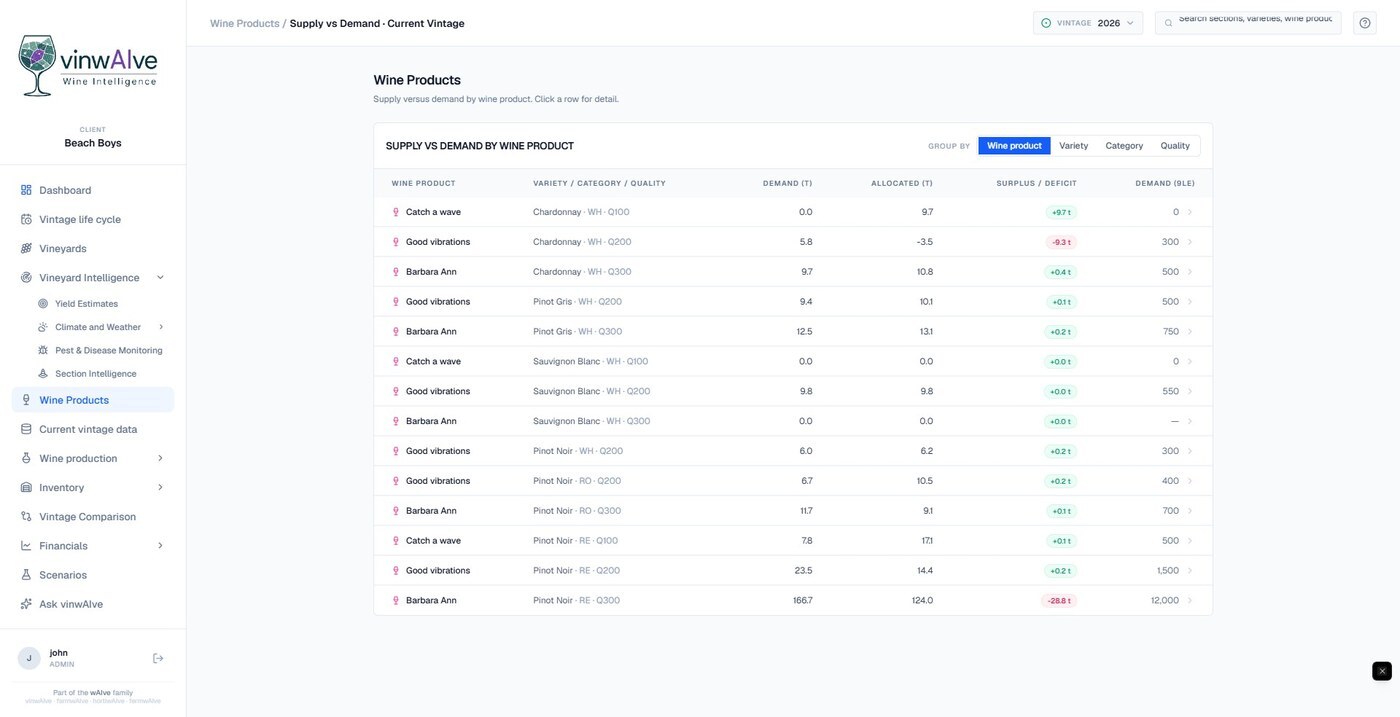
Know which wine labels are actually making you money
Trace every block to the label it feeds. See supply versus demand by SKU in tonnes and 9-litre case equivalents, surplus and deficit flagged per product. Make allocation, replanting and pricing decisions from actual margin data instead of assumptions.
Yield forecasts that stay current without the rebuild
Field-scored yield samples per section, by growth stage, rolled up live across the estate. Supply commitments, winery schedules and harvest logistics run on current data rather than last year's actuals and a gut feel. Harvest progress tracks fruit kept versus sold against the estimate as it comes in.
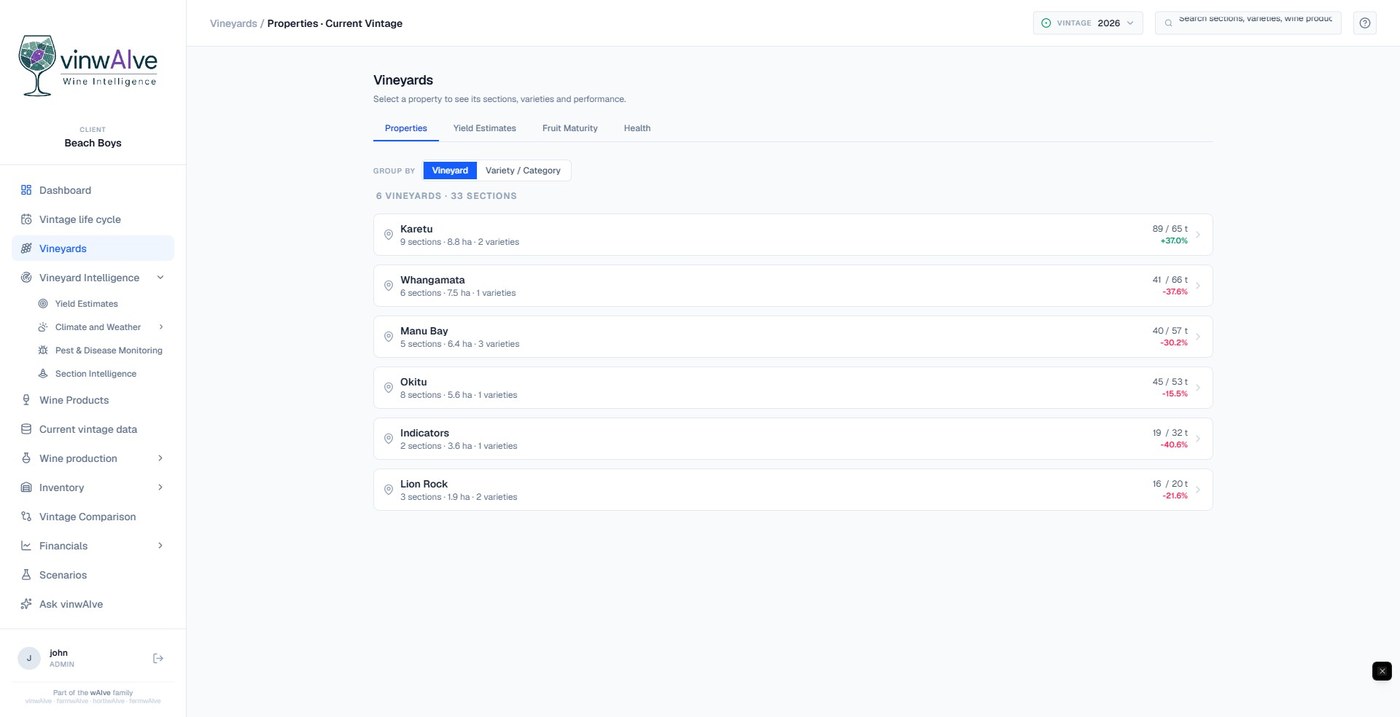
One view across your whole portfolio
Running more than one property? vinwAIve gives you one view across all vineyards with section-level detail on demand: group by property, variety, category or quality tier and compare side by side.
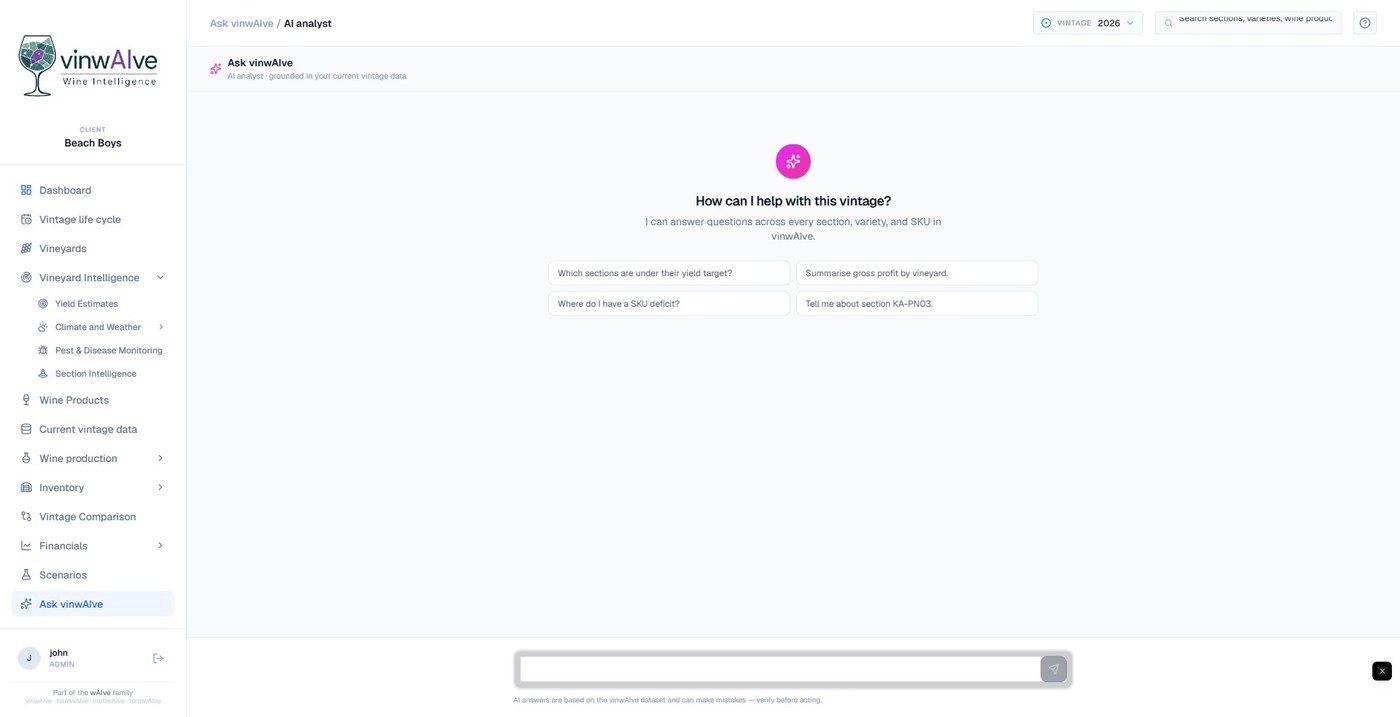
Ask your estate anything. Get an answer in seconds.
Which sections are under yield target? Where do I have a SKU deficit? Tell me about section KA-PN03. Plain-language answers grounded in your actual estate data. No pivot tables. No three-hour rebuild.
What's happening in the rows, not just the ledger.
vinwAIve now runs your vineyard operations alongside your financials, so scouting, field notes, maturity and weather live in the same platform as your margins, and the AI reasons across all of it.
Pest & disease monitoring
Structured scouting observations across diseases, pests, beneficial insects and disorders. Filter by vineyard, variety, quality tier or section, with a draft-and-post workflow your whole team can use from the field.
Field observations
A live feed of notes posted from the vineyard, each tagged Good, Concern or Alert and tied to a section. Tap a section code and the full detail, history and financials open alongside it.
Fruit maturity
Per-section maturity sampling tracked through the ripening curve, sitting next to the same section's yield estimate and P&L, so picking decisions balance flavour, tonnage and margin.
Weather & climate
Live weather station feeds per property, district forecasts and seasonal data embedded in the platform. Soil moisture and irrigation integrations are on the roadmap next.
Section intelligence
Every observation, sample and dollar rolls up into a traffic-light ranking of your sections by yield and cost versus target, so the day's priorities set themselves.
One brain across it all
Because operations and financials share one platform, the AI can connect a disease flag to a yield risk to a margin impact on the label that block feeds.
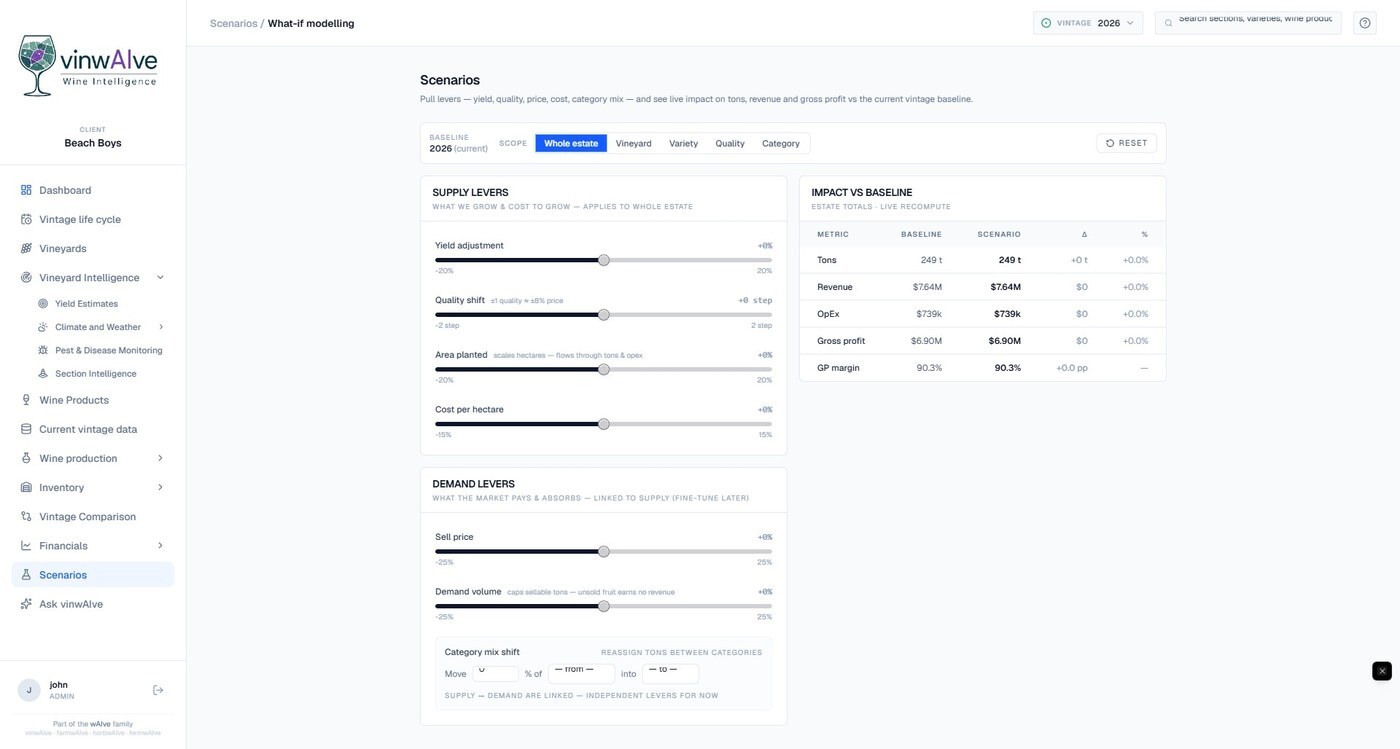
Pull the levers before the vintage does.
What happens to gross profit if yield drops 10%? If you shift a block up a quality tier? If the market pays 5% less? Scenarios lets you pull supply and demand levers and watch the impact on tonnes, revenue, OpEx and GP recompute live against your current vintage baseline.
Supply levers
Demand levers
Impact vs baseline · live recompute
| Tonnes | 249 t → 261 t |
| Revenue | $7.64M → $8.02M |
| OpEx | $739k → $748k |
| Gross profit | $6.90M → $7.27M |
| GP margin | 90.3% → 90.7% |
Illustrative scenario. Every lever recomputes estate totals instantly against your own vintage baseline.
Run this vintage. Plan the next. Benchmark the last three.
vinwAIve manages the whole vintage life cycle: move the current vintage through its stages, close it off with a clean audit trail, and promote the next one, while Vintage Comparison puts year-on-year yield, tonnes and targets side by side.
Vintage life cycle
Stage the season from budburst to close-off. Closed vintages are locked for a clean record, with administrator unlock for corrections. Next vintage planning starts while the current one runs.
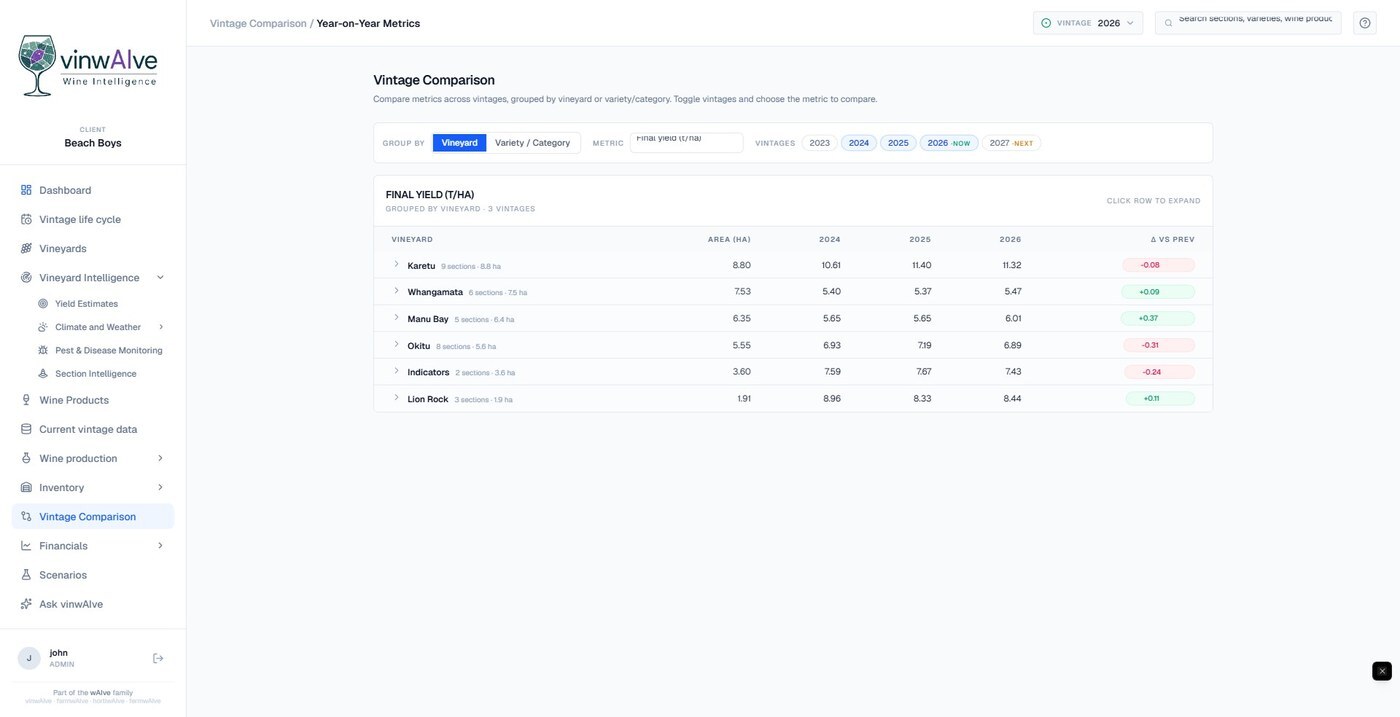
Vintage comparison
Compare final yield, tonnes, estimates and targets across vintages, grouped by vineyard or variety. See which blocks are trending up and which are quietly sliding, year on year.
Targets with memory
Every target you set is benchmarked against what the same section actually delivered before, so next season's plan is built on evidence rather than optimism.
Every answer your estate holds, at your fingertips.
vinwAIve's AI doesn't just retrieve data. It reasons across your entire estate, connecting yield, operations, cost, allocation and financial performance to surface what matters before it becomes a problem.
Predictive
"Which sections are under their yield target right now, and which are at risk of missing their GP?"
Preventative
"Where do I have a supply deficit against demand, and which wine products are most exposed?"
Root cause
"Summarise gross profit by vineyard and tell me which property is dragging down my estate margin."
Allocation
"Which sections are dragging down my reserve label's blended GP? What happens if I move the weakest one out?"
Operations
"Show me every Alert observation from the last fortnight and the yield trend in those sections."
Planning
"Based on this vintage, which sections should I increase investment in next year, and which should I re-evaluate?"
vinwAIve sits at the centre of the systems you already run.
No rip and replace. vinwAIve links the production, accounting, compliance and warehouse systems your estate already uses, and imports your existing spreadsheets, so the intelligence layer sits over the top of everything.
Product names are the property of their respective owners. Integration depth varies by system, from linked portals to imported data.
Every number your estate generates. Finally connected.
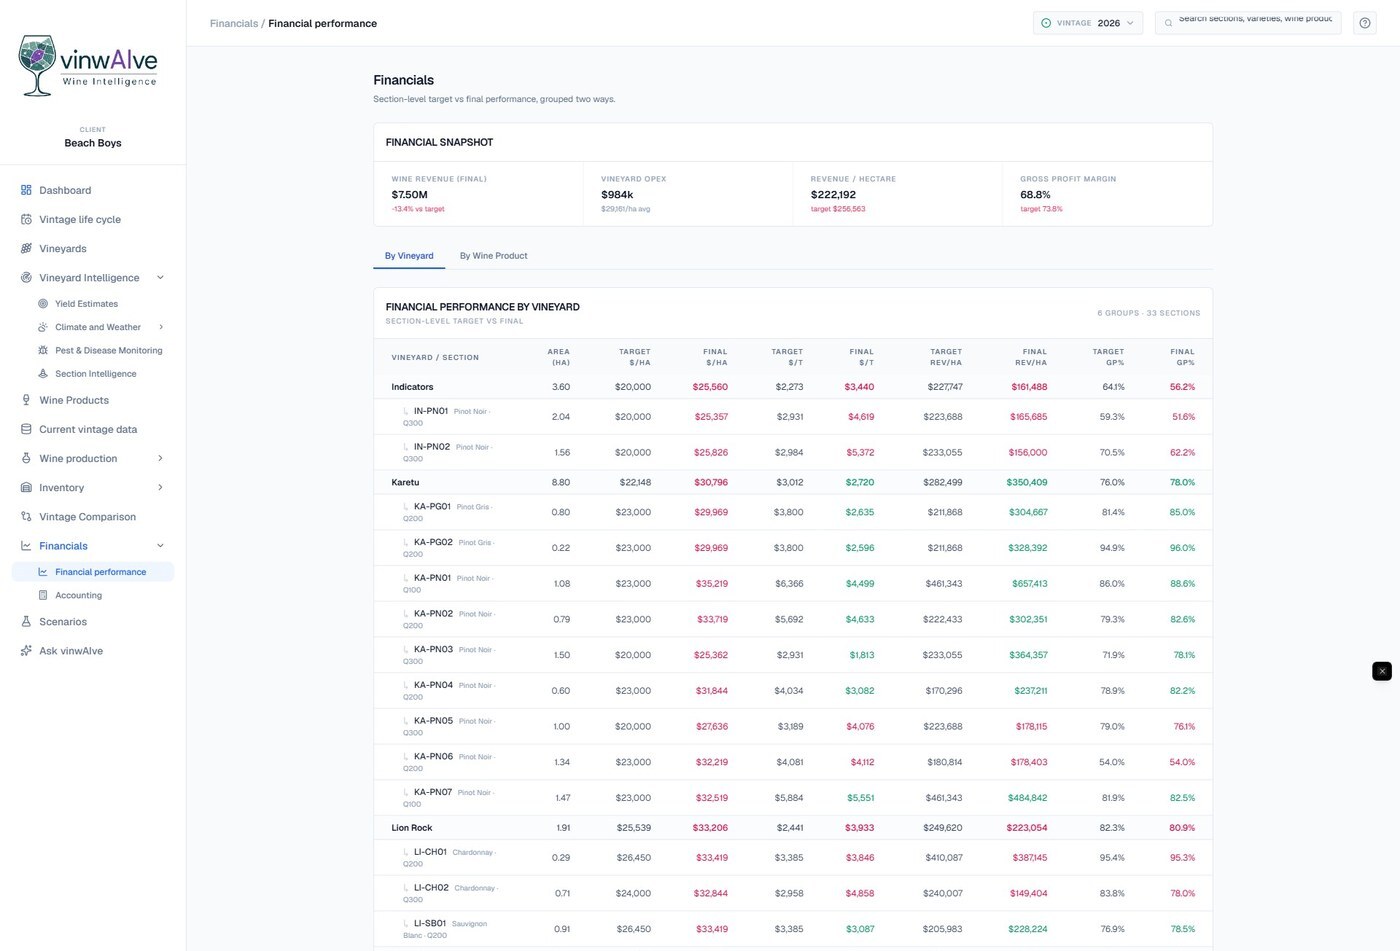
Financial Performance
- Total wine revenue vs target
- Vineyard OpEx and cost per hectare
- Revenue per hectare by section and vineyard
- Gross profit margin %, section and estate level
- Cost per tonne: target vs actual variance
- GP% trajectory in-season vs end-of-vintage
Yield Intelligence
- Total estate yield: target vs current forecast
- Field-scored samples per section, by growth stage
- Variety-level yield breakdown
- Tonnes per hectare: target vs forecast vs final
- Harvest progress: kept vs sold, live
- Historical yield benchmarking by block
Operations Intelligence
- Pest and disease scouting observations
- Field notes: Good / Concern / Alert by section
- Fruit maturity sampling per section
- Live weather stations and district forecasts
- Traffic-light section rankings, yield and cost
- Seasonal and regional viticulture data
Wine Product & Allocation
- Section-to-wine-label allocation mapping
- GP% and revenue per hectare by wine product
- Supply vs demand by SKU: tonnes and 9LE cases
- Surplus and deficit flagged per product
- Multi-product contribution to estate GP
- Category and quality-tier roll-ups
Scenario & Vintage Planning
- What-if levers: yield, quality, price, cost, mix
- Live GP impact vs current vintage baseline
- Year-on-year vintage comparison
- Vintage life cycle: stage, close-off, promote
- Next-vintage targets built on actuals
- Rolling variance summary across the estate
AI-Powered Insights
- Traffic-light flags: sections drifting off target
- Predictive vintage revenue and margin forecasts
- Root-cause analysis for every variance
- Outperformer identification
- Allocation recommendations from live data
- Natural language Q&A across the full estate
Still running on spreadsheets and a six-week-old vintage report?
| Capability | vinwAIve | Spreadsheets | Generic farm software | Legacy vineyard tools |
|---|---|---|---|---|
| Section-level financial performance | Yes, live | Manual, error-prone | Not available | Partial / end of season |
| Traffic-light target vs actual tracking | Yes, in-season | Manual updates only | Sometimes | Sometimes |
| Pest & disease scouting with financial context | Yes | No | Scouting only | Scouting only |
| What-if scenario modelling on GP | Yes, live recompute | No | No | No |
| Year-on-year vintage comparison | Yes | With effort | No | Varies |
| Wine product to section traceability | Yes | No | No | Rarely |
| GP% by block, by wine label | Yes | No | No | No |
| Predictive vintage revenue forecasting | Yes | No | No | No |
| AI natural language querying | Yes | No | No | No |
| Weather & climate feeds per property | Yes | No | Sometimes | Varies |
| Multi-vineyard portfolio view | Yes | With effort | Sometimes | Varies |
| Built specifically for premium wine estates | Yes | Generic | Generic | Sometimes |
Your data is already there. We connect to it.
No IT project. No data migration. No starting from scratch. vinwAIve links the systems your estate already runs and imports the data it already produces, and gets you up and running within a single onboarding session.
Spreadsheet import
Upload your existing yield workbooks, section data and financial records. vinwAIve parses them automatically, no reformatting required. Most estates are up and running within a single onboarding session.
System connections
Link your production database, accounting software, compliance portals and warehouse systems so everything your team needs sits behind one login, with data imports keeping the picture current through the season.
Guided onboarding
You do not need an IT team. Our onboarding maps your estate structure, sections, varieties and wine products into the platform. We do the setup. You get the visibility, usually within the first session.
Your data stays yours. vinwAIve does not share, sell, or aggregate your estate data across accounts. Everything is encrypted and accessible only to your team.
Everything you need to know
What is vinwAIve?
vinwAIve is an AI-first vineyard management and wine intelligence platform that connects yield estimates, section-level financials, vineyard operations and wine product performance for premium wine estates. It replaces disconnected spreadsheets and generic farm software with a single platform that tracks cost per tonne, gross profit by section, pest and disease pressure, and answers plain-language questions about your estate in real time.
Who is vinwAIve built for?
vinwAIve is built for premium and commercial wine estates managing multiple vineyards or blocks, particularly those currently tracking yield, cost, scouting and revenue across spreadsheets, printed maps and disconnected accounting or farm management tools. If you are running more than one vineyard and making decisions from incomplete data, vinwAIve is built for you.
How is vinwAIve different from other vineyard management software?
Unlike generic vineyard or farm management software, vinwAIve connects yield forecasting, vineyard operations and financial performance at the section level. It answers plain-language questions across your entire estate dataset, ranks at-risk sections with traffic lights before the vintage ends, and models what-if scenarios on yield, price, cost and category mix with live gross profit impact. Most platforms report what happened. vinwAIve tells you what is happening now and what to do about it.
What does the pest and disease monitoring do?
vinwAIve records structured scouting observations across diseases, pests, beneficial insects and disorders, filtered by vineyard, variety, quality tier and section. Observations sit alongside each section's yield estimate and financials, so a disease flag is immediately visible in the context of the tonnage and margin it puts at risk. A separate field observations feed captures Good, Concern and Alert notes posted from the vineyard.
What is scenario modelling in vinwAIve?
Scenarios lets you pull supply levers (yield, quality shift, area planted, cost per hectare) and demand levers (sell price, demand volume, category mix) and see the impact on tonnes, revenue, OpEx and gross profit recompute live against your current vintage baseline. You can scope a scenario to the whole estate, a single vineyard, a variety or a quality tier before committing to a decision.
Can vinwAIve compare vintages?
Yes. Vintage Comparison puts year-on-year metrics side by side, grouped by vineyard or variety: final yield, tonnes, estimates and targets across vintages. The vintage life cycle moves each season through its stages, closes it off with a locked record, and promotes the next vintage so planning starts while the current season runs.
What data does vinwAIve connect and analyse?
vinwAIve connects yield estimates, fruit maturity, pest and disease observations, weather feeds, cost per tonne, cost per hectare, gross profit margin, revenue per hectare, wine product allocations, supply versus demand by SKU, and multi-vineyard portfolio performance. Individual vineyard sections are mapped through to wine product labels and financial outcomes, giving a complete picture from vine to bottle.
Can vinwAIve manage multiple vineyards?
Yes. vinwAIve is designed for multi-vineyard wine estates and provides a consolidated portfolio view across all properties, with individual section-level drill-down for each vineyard. Compare performance across vineyards, varieties and vintages from a single dashboard without managing separate trackers or spreadsheets.
How does the AI work in vinwAIve?
vinwAIve uses AI to forecast vintage revenue, identify underperforming vineyard sections, model supply and demand scenarios, and answer natural language questions about your estate data. Ask questions like "Which sections are under their yield target?" or "Where do I have a SKU deficit?" and get immediate answers grounded in your actual estate data.
What is section-level vineyard analytics?
Section-level vineyard analytics means tracking yield, cost, operations and financial performance for each individual block rather than relying on estate-wide averages. vinwAIve reveals the performance variance hidden inside those averages, showing exactly which sections are profitable, which are at risk, and where the biggest improvement opportunities sit. On many estates, the gap between the best and worst performing sections exceeds 50 gross profit points.
We already use Vintrace, Vinsight or InnoVint. Does vinwAIve replace them?
No. vinwAIve is not a winery production system. It sits alongside your production database as the intelligence layer, and links Vinsight, Vintrace or InnoVint directly into the platform per property, together with your accounting, compliance and warehouse portals. Think of it as the platform that makes sense of the data your other tools produce, with one login to reach all of them.
Does vinwAIve include weather data?
Yes. Live weather station feeds can be linked per property, alongside district forecasts and seasonal viticulture data, all embedded in the platform. Soil moisture and irrigation controller integrations are on the product roadmap.
What if our data is messy or incomplete?
Most estates start with imperfect data and that is fine. vinwAIve works with what you have. During onboarding we identify gaps and help you understand what data will give you the most value to capture going forward. You do not need years of clean historical records to get immediate insight from this vintage's data.
Is our vineyard data secure and private?
Your data is yours. vinwAIve does not share, sell, or aggregate your estate data across accounts. Each estate operates in a fully isolated environment, your data is never used to train models or benchmark against other estates, and all data is encrypted in transit and at rest. You control who sees what, and nothing leaves your account without your action.
Can we control who has access to what data inside the platform?
Yes. vinwAIve has a full role-based permission system. A vineyard manager can be given access to yield, scouting and block data without seeing company financials. A winemaker can view grape allocations and wine product data without accessing cost reports. Read-only roles suit consultants, advisors and board members. The account admin has full visibility, manages users and permissions, and is the only role with access to billing and integration management.
When can I get access to vinwAIve?
vinwAIve is currently onboarding wine estates ahead of the next vintage season. Book a demo to walk through the platform with your own estate data and see exactly what section-level visibility looks like for your operation. Early access estates receive priority onboarding support.